Happy 2025!
In our previous Platform Analytics (PAE) blog, we wrote about what Platform Analytics is and that the Zurich release will force the migration of the current Dashboarding and Reporting (including Performance Analytics) to PAE, if you don’t do it yourself before then. Everything will be in one unified experience.
2025 will be the year of Platform Analytics, even if you don’t want it to be.
Your time to act is now.
Testing the migration
With Zurich planned for Q3 of this year, it only gives you a short amount of time to test the migration and do a cleanup (the migration tool is available as of the Washington release).
Why test the migration?
That’s a very simple answer: you want to know that your most used dashboards or the highly customized ones will still work after the migration. You want to see if any changes need to be made to them, before you migrate everything yourself (or have ServiceNow do it for you with the upgrade to Zurich).
Prepare the migration
I am not going to talk about preparing your users in this blog. Although it’s very important to inform them or even let them already start using it, it’s up to you to decide how you are going to tackle the ‘people’-problem this migration is going to bring. If you need assistance with this, our contact information is at the bottom of this blog.
Why do a cleanup?
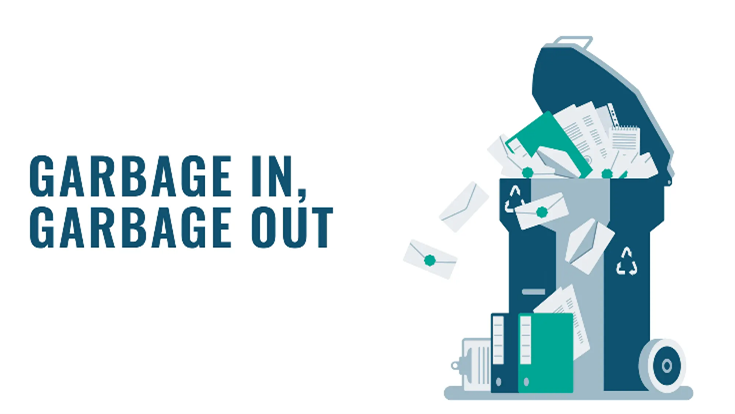
Because you won’t do it after the migration.
Is it necessary or mandatory to do a cleanup?
No. Everything will be migrated but why would you fill your new way of working with reports and dashboards nobody has used in years and will probably never use again?
The ServiceNow community has a massive amount of information related to PAE, including this article from Dan Kane (Outbound PM at ServiceNow). It contains a presentation on how you could clean up your existing content (again, it’s not a mandatory task but I personally like to work in a clean room without clutter).

With the migration not only the dashboards and reports are being migrated, but the PA widgets, indicators, scheduled reports and everything else related to dashboarding and reporting as well. Deleting or archiving things you aren’t using helps in starting clean.
Do you know how many reports have been created at one time and have never been used again?
Do you know how many dashboards are active, created by a user that is no longer with the company and not shared with anyone else?
Do you know how many scheduled reports are active but are never generated because either the user running the report or the recipient(s) are inactive?
Do you know how many indicators have been created but are not being collected?
Do you know how many reports are checking for the same data (e.g. active incidents)?
There are several tools available in your instance to do these checks
- Admin console (under Performance Analytics)
- Report statistics (report_stats)
- Dashboard statistics (dashboard_stats)
- Widget statistics (report_stats where widget is not empty)
- Scheduled report list (look for ‘run as = inactive user’)
- Indicators without a related job (pa_indicators with 0 related_jobs)
If any of the records you find are already inactive, do you want them to migrate? Or will you just delete them (or archive them as Dan describes in his article).
If any of the records you find have not been used for over a year, do you think they are going to be used after the migration? If not, delete or archive them.
If you have multiple indicators running on the same indicator source, check if they aren’t just collecting the same data twice. Is that necessary?
Keep it clean
Do you remember the number of times you were asked as a kid to clean up something? And how long it took to finish cleaning up after you didn’t do it for a while? Same goes for ServiceNow. You are retiring old knowledge articles. Old CI’s are put to non-operational. Why not keep your reports and dashboards clean as well? A few tips:
- Continue cleaning up (run weekly jobs checking on visualizations and dashboard that have not been used for a year)
- Use the new ‘certification’ option on dashboards and visualizations so users can check on the ‘company approved’ items and maybe use those instead of creating their own
- Apply Data Source control, so not just every user can create visualizations from indicators, not knowing the data behind it
- Check the Admin console regularly for unused items
WhiteBrick Supports
You don’t have to clean up. You don’t have to test the migration. Just know that with Zurich, ServiceNow will do it for you.
Don’t underestimate the impact this transition will have. Start planning now. WhiteBrick can assist with your cleanup and migration efforts. We can also assist in helping you prepare your people with a demo or help you prepare instructions for your users.
If you need assistance or want a copy of our comprehensive document outlining the process, including how to create new visualizations, contact us at [email protected]. Existing customers can of course use the known channels.
Follow us on LinkedIn to stay updated on Platform Analytics and other ServiceNow-related content.
Our Platform Analytics blogs
Platform Analytics I – ServiceNow Platform Analytics (June 2024)
Platform Analytics II – Prepare your migration (January 2025)
Next PAE blog: Create dynamic scheduled reports


